
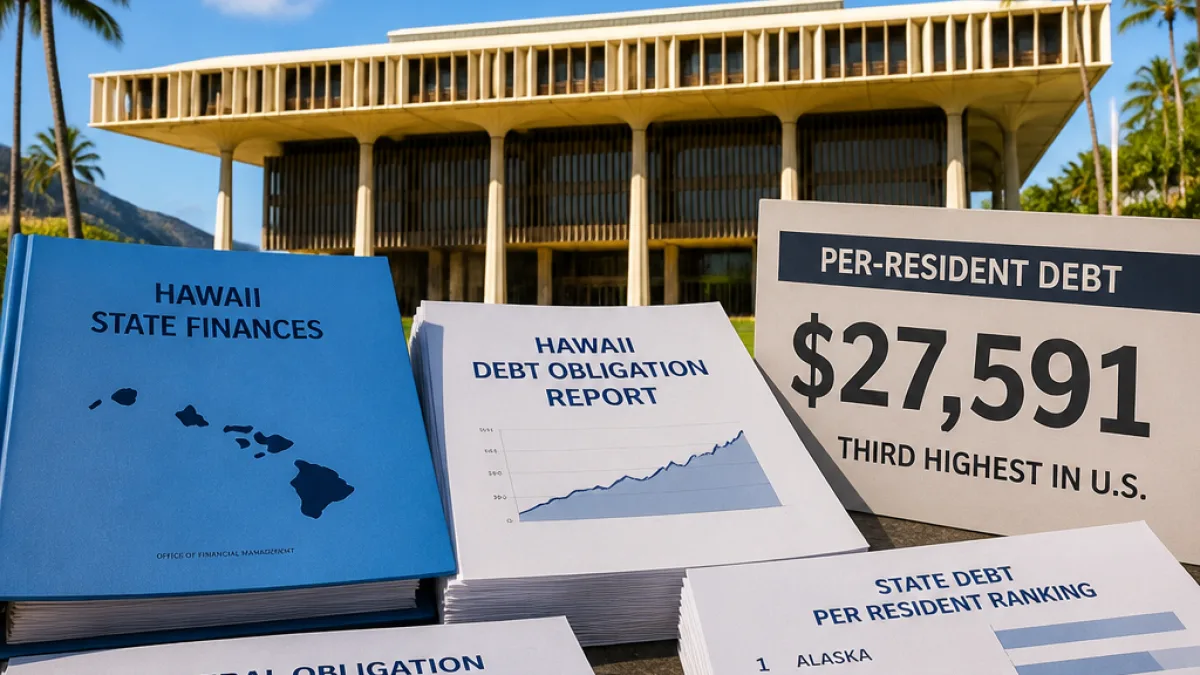
Hawaii ranked third among the 50 states in government debt per resident in a new analysis of state finances, placing it behind only Connecticut and New Jersey. The study reported $19,553 in debt per capita for Hawaii at the end of fiscal year 2024.
The findings come from the Reason Foundation’s State and Local Government Finance Report, which examined liabilities reported by state governments nationwide. Hawaii’s per-resident figure was lower than Connecticut’s $25,381 and New Jersey’s $22,933, but higher than the amounts reported for Illinois, Massachusetts and Delaware.
The ranking is a measure of obligations carried by the state government, not a statement that every Hawaii resident personally owes that amount. The report assigns total state liabilities across the population to create a common comparison among states of different sizes.
What the study counts as debt
The report’s definition is broad. It includes short-term obligations, such as unpaid bills and accrued salaries, as well as longer-term commitments. Those longer obligations include bonds, loans, unfunded pension liabilities and retiree health care benefits.
That approach means the total is wider than outstanding bonds alone. It also incorporates future costs that state governments have recorded on their balance sheets but may pay over many years. The report said state governments collectively carried $2.6 trillion in total debt at the close of fiscal 2024, including $1.9 trillion in long-term debt.
| Measure | Hawaii | National comparison |
|---|---|---|
| Total debt per resident | $19,553 | Third-highest among states |
| Long-term debt per resident | $16,514 | Third-highest among states |
| Reporting period | Fiscal year 2024 |
Long-term obligations drive much of the burden
Hawaii also ranked third in the report’s comparison of long-term debt per resident, with $16,514. Connecticut led that category at $23,322 per person, followed by New Jersey at $21,239.
Across the country, the report said unfunded pension liabilities represented 36% of state governments’ long-term debt. Bonds, loans and notes accounted for 33%, while unfunded retiree health care made up 21%. Accrued leave payouts and other categories represented the remainder.
Those categories matter because they reflect different kinds of financial commitments. Bonds and loans generally arise from borrowing for public purposes, while pension and retiree health liabilities represent promised benefits whose costs extend into the future. The report combines them in its long-term debt calculation.
Hawaii’s position in the national picture
Hawaii was one of six states with more than $17,000 in total debt per resident. Illinois ranked fourth at $17,859, followed by Massachusetts at $17,536 and Delaware at $17,445. Alaska, Wyoming, Washington, North Dakota, California, New York, Vermont and Maryland also exceeded $10,000 per resident.
The contrast with lower-debt states was substantial. Utah had the nation’s lowest per-capita figure at $1,856, the only state below $2,000. Tennessee, South Dakota, Indiana and Idaho followed, each reporting less than $3,000 per resident.
- Connecticut: $25,381 per resident
- New Jersey: $22,933 per resident
- Hawaii: $19,553 per resident
- Illinois: $17,859 per resident
- Massachusetts: $17,536 per resident
Total dollars tell a different story
Hawaii’s high per-capita ranking does not mean it has the largest overall debt balance. Larger states reported greater totals because they have substantially larger populations and broader governments. California led the nation with $455 billion in total debt, followed by Illinois with $229 billion, New York with $228 billion, Texas with $214 billion and New Jersey with $213 billion.
Massachusetts and Washington each exceeded $100 billion in total debt. At the other end of the scale, South Dakota reported $2.2 billion and was the only state below $5 billion. Twelve states had total debt below $10 billion, according to the report.
What the ranking does — and does not — show
The figures offer a comparison of reported state-government liabilities, but they do not by themselves explain why one state ranks above another or how debt affects a particular household. The study does not provide a forecast of Hawaii taxes, public spending or future borrowing in the supplied findings.
It also does not present a separate assessment of Hawaii’s ability to repay its obligations. Instead, the report supplies a standardized snapshot based on balance-sheet information for fiscal 2024. Readers can review the foundation’s state-by-state finance tool for the underlying comparisons and categories.
For Hawaii, the central takeaway is the state’s position near the top of the national per-capita list, particularly in long-term obligations. The ranking brings pension, retiree health care, borrowing and other liabilities into the same discussion, giving residents a way to compare the scale of the state government’s recorded commitments with those elsewhere in the country.